
How to craft an Automotive New Product Innovation Strategy using TRIZ
1.0 India as a global automotive innovation hub
Automotive new product development is a very exciting domain for engineers. The modern automotive product brings together many emerging technologies like AI, IoT, Data Analytics, Advanced Materials, Mechatronics, Advanced Manufacturing, Energy storage etc. The traditional automotive industry, that was dominated by Internal Combustion Engine (ICE) vehicles powered by fossil fuels, is being disrupted by electric, autonomous and connected vehicle technologies. The emergence of shared ownership models is further disrupting the automotive business. While the customer needs and market dynamics are changing rapidly, the technologies that enable the automotive products are growing exponentially and converging. Indian Automotive OEMs have an opportunity to innovate and create a business advantage through differentiated products. They have the opportunity to lead not only in the Indian markets but also take their innovative products to global markets. The chairman of one of the leading Indian Automotive OEMs remarked that India should lead the R&D and own the technology to be a global EV hub and added “We should come together to create the infrastructure and the ecosystem that India needs to become the global hub for EVs. We should combine the skills of the Industry and the reach of the Government to bring about the change. We need a joint transition plan that takes care of the economy, the environment & the people [1]”.
Indian Automotive OEMs can become global innovation leaders by (a) understanding the technology evolution trends and staying ahead of the curve by adapting the right technology early and (b) leveraging the technology to create true value for the customer (Main Parameter of Value, MPV). Technology adaption (TA) and Customer focus (CF), will serve as the two eyes of a visionary leader. TA and CF are not new concepts – but their management has become more and more difficult with increasing volatility, uncertainty, complexity and ambiguity (VUCA) in the automotive world. Is there a systematic approach and a structured framework to ensure that we don’t lose sight of early TA and intense CF during automotive new product development? We looked at the science of technology life cycle analysis (TLCA), theory of inventive problem solving (TRIZ) and design thinking (DT) to create a powerful tool for automotive product innovators. The first author (TKV) has a rich experience in systematic innovation using TRIZ and the second author (SV) has been leading automotive new product innovation at a leading OEM – the two authors decided to collaborate and co-create a powerful strategy for automotive new product development that would enable Indian Auto OEMs to create world class products for global markets. The innovation strategy is aimed at mitigating technology risks and strengthening the focus on customer value creation.
2.0 Customer Value Creation drives Innovation – S Curve Analysis
Innovation opportunities start with understanding the customer needs, better known in the industry as Voice of Customer (VoC). To create increasing value for the customers, every business is focused on contributing to new or enhanced solutions (Products, Manufacturing process, Software or Services). The focus areas that are most important to the product’s performance are referred to as Critical to Quality (CTQ) parameters. When we use structured innovation methods like TRIZ to build innovative products, we refer to the key parameters of differentiation as Main Parameter of Value, MPV. In other words, MPVs are key attributes / outcome of a product/ service that is important to the purchase decision process. In the context of automotive products, increasing safety, reducing total cost of operation and reducing environmental pollution have been the MPVs. With the emergence of new customer needs and disruptive technologies, new MPVs such as driver assist features, infotainment, smart and connected features etc. are emerging as product differentiators [2].
To explain the innovation strategies and to adopt the right one, we delve deep S-curve analysis and Trends of Engineering System Evolution and map them for a given MPV. In the context of automotive products, we have considered reducing vehicular emissions and improving energy efficiency as critical direction for improving the product performance (MPVs). New MPVs evolve with technology enhancements. For example, the introduction of connectivity in a car brings smart features as a new class of MPV. Introducing autonomous driving features in a car brings the five levels of autonomy as a new class of MPV [3].
S-curve analysis is an analytical tool that helps us to determines where the sub-system / component as an engineering system is in its present case and what steps should be taken to improve it. It is done at a component level and sometime one can expand to the system level. There are three important steps to understand and benefit from this analysis.
- The first is the idea of Functionality as the language of innovation. Just like one has to learn the C programming language in order to program in C, one has to understand functionality, the “language of devices / processes”. For example, the primary function of a car as a system is to transport a person from point A to point B. Similarly, every benefit that is offered to a customer can be quantified in terms of functions. The function of various sub-systems and components like engine, brake etc can also be defined along the same lines.
- The second is the powerful concept of “Ideality”. It is the ratio of benefits (F, Functionality) in the numerator over penalties (C, Cost + Environmental Harm) in the denominator. Improving the fuel efficiency, enhancing passenger safety, improving passenger comfort etc enhances the “benefits” (F) in the numerator. Reducing the tailpipe emission of the vehicle, the initial cost and operational cost of the vehicle reduces the “penalty” (C) in the denominator.
- The third is to understand the evolution of how an engineering system acquires key functions critical for its development… Refer Figure 1.
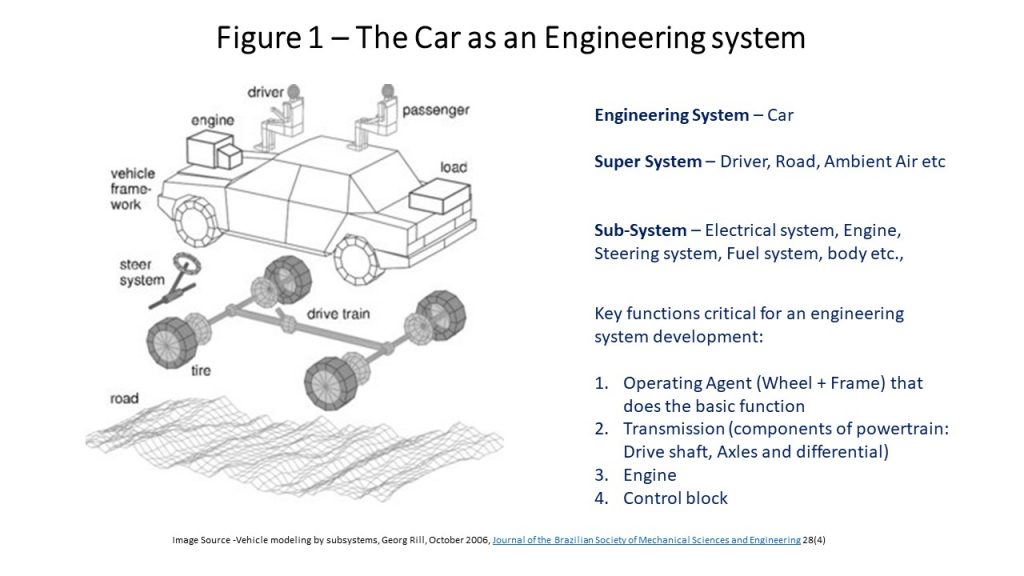
Figure 1: The Car as an Engineering System
- The function of Operating agent. Part of the Engineering system that does the basic function, Wheel + Frame.
- The Function of transmission. The part of the engineering system or its super system that transfers a field (energy) from an energy source to an operating agent e.g The powertrain of the car takes power from the engine and delivers it to the wheels. The key components of a powertrain include transmission, driveshaft, axles, and differential.
- The function of the Energy source. The part of the Engineering system or its super system that generates energy to operate the system, for example, the engine of an automobile.
The Function of Control system. The part of an Engineering system or its Super system that controls how the other components function, for example, the thermostat in a HVAC system.
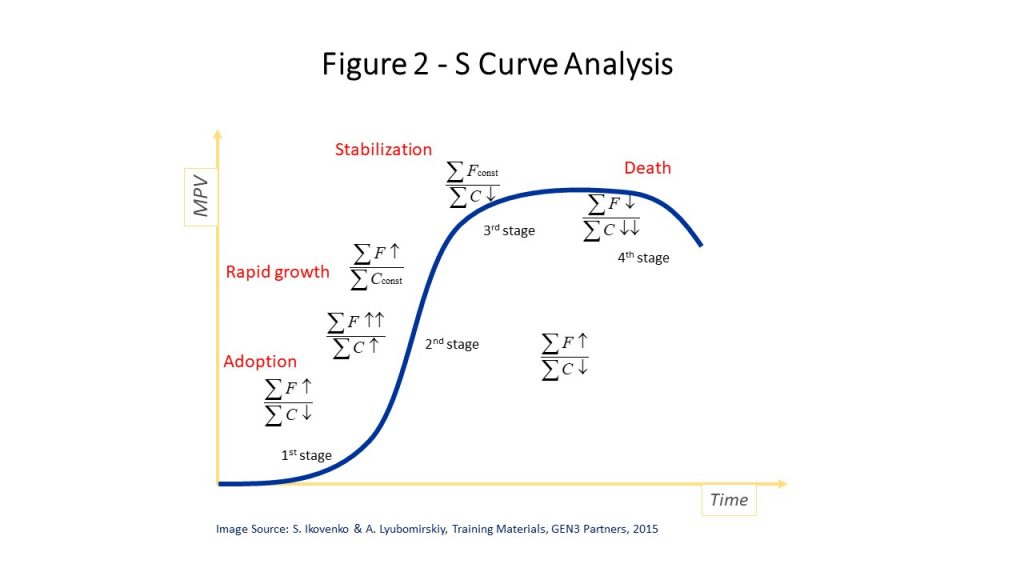
Figure 2: S Curve Analysis
In the S curve (Figure 2) above, the First Stage is adoption. This phase is when the vehicle as an engineering system is born and when the principle of action is first applied to deliver its main function. The focus of innovation is to address an important parameter (MPV) that the customers are interested in. The early adoption can be studied as two stages.
1700 – 1890: The early “vehicles” were powered by steam (an energy source that had been used for many years to power trains). However, it wasn’t until the 1870s that steam power became more practical for small vehicles. Despite improvements, there were still a lot of shortcomings. Steam-powered vehicles took a very long time to start up and the range was limited. In the early 1800s, inventors around the world began building electric-powered vehicles. When an electric car (that could go 14 miles per hour) was introduced in 1890, within the next ten years a third of the vehicles in the U.S. were electric. Electric vehicles were popular because they weren’t as difficult to start as steam and gas combustion engines and operation didn’t involve difficult gear shifts. In 1898, the first hybrid vehicle that was powered by electricity and gas was introduced. When we try to analyse the driving factors behind the first wave of innovations, why steam gave way to electric and why electric subsequently gave way to other fuels, it is easy to see that “ease of operation” was the MPV.
1890 – 1930: The first gas-powered car was introduced in 1895. This gas-powered car was the precursor to the modern automobiles. At the time electric vehicles were on their way to being the norm – but they were too expensive for the middle class. Then came Henry Ford’s 1908 Model T – with the invention of the assembly line, the gas-powered Model T could be mass-produced and became affordable for the general population. The invention of the electric starter (in 1912) eliminated the need to hand-crank gas-powered vehicles. Once oil was discovered in Texas and gasoline became cheap gas-powered vehicle sales began to surge. When we try to analyse the driving factors behind the second wave of innovations, why gas-powered vehicles and Ford’s Model-T became popular, it is clear that “cost” was the MPV. Mass production made the car affordable and the oil discovery made the energy source easily accessible. The fall in the initial cost and the cost of operation (mainly fuel cost) accelerated the adoption of cars.
The Second Stage (Figure 2) is a rapid growth phase. As the solution gains adoption by many, the only focus is to increase value (numerator) and it leads to investing additional costs (denominator). With time as the competition builds in, the next focus is to reduce the denominator and still increase the value (numerator). The next wave of innovations introduced many new and useful features like speedometers, seatbelts, windshields and rear-view mirrors. The next generation of cars featured power steering (1951), cruise control (1957), three-point seatbelts (1959) etc. In 1973, the first passenger airbag was introduced. In the late 80’s and early 90’s keyless entry systems, electric doors and windows, sunroofs and CD players began to be standard features. Initially the cost increased due to the introduction of new features, but the cost stabilized over time as these technologies matured. There was also market pressure to keep the price low to stay competitive. When we try to analyse the driving factors behind the third wave of innovations, the introduction of many new features, it is evident that “ease of use”, “passenger safety” and “passenger comfort” became the MPV.
The third Stage (Figure 2) is a stabilization phase. With time solutions would hit fundamental limitations and it would be difficult to increase the numerator further for a given MPV using a given technology. Hence the focus is to reduce the factors in the denominator – like cost, emission etc. Many OEM’s have cost out programs to be competitive in the market. The tailpipe emission of vehicles have reduced significantly over the years with the development of aftertreatment technologies (EGR, SCR). Compared to 1970 vehicle models, new cars, SUVs and pickup trucks are roughly 99 percent cleaner for common pollutants (hydrocarbons, carbon monoxide, nitrogen oxides and particle emissions). New heavy-duty trucks and buses are roughly 99 percent cleaner than 1970 models [4]. This is also the stage where the technology starts saturating (hits a plateau). This is the right time to initiate the development of next generation technology (beginning of the next S curve).
The Fourth Stage (Figure 2) is the death of the current technology. While the energy efficiency of ICE (Petrol) vehicles range from 11 to 27%, the energy efficiency of ICE (Diesel) vehicles range from 25 to 37%. There has been no significant increase in energy efficiency of ICE vehicles for the last few years. When we compare this with the energy efficiency of the next generation electric vehicles, the values range from 40 to 70% (depending on the renewable source of electricity used to charge the EVs).
The S curve analysis clearly indicates that the two MPVs that trigger the disruptive shift from ICE vehicles to EVs comes from energy efficiency and emissions. The existing IC Engines have almost reached their entitlement on both energy efficiency and emissions. To explain this shift, below chart demonstrates the evolution of the technologies to reduce vehicular emissions, an MPV. The disruptive shift in the automotive technology is driven by the change in the functional principle at the Energy source level. In ICE vehicles, chemical and thermal energy was converted in two steps to kinetic energy. While in an EV, electrical energy is converted in a single step into kinetic energy. The energy conversion efficiency in EV is much higher as compared to ICE vehicle.
3.0 New Product Innovation strategies
Further the explanation on how technology evolves along an S curve and what innovation strategies are adopted is a critical aspect to develop new product development strategy.
There are four main innovation strategies that can be adopted by the understanding where a given component or system is in its evolution along S-curve.
The parameter that changes along the S-curve is the ratio of benefits / penalties. Based on its present stage on the S Curve (Figure 3) and understanding the existing competition, we can adopt any of the four strategies as explained below.
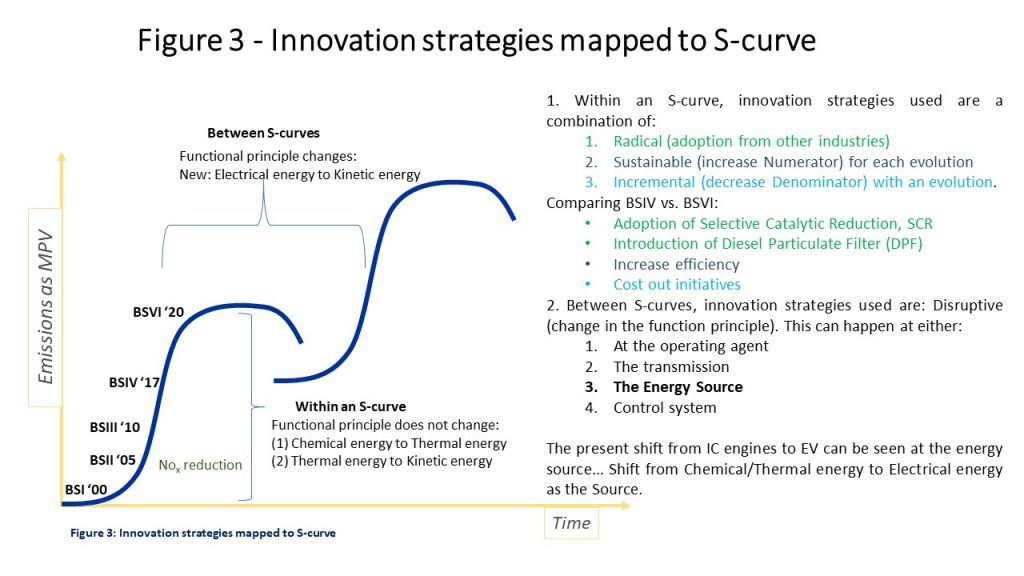
Figure 3: Innovation Strategies mapped to S – curve
Incremental innovation – By redistributing the functionality, an inward approach for simplification. It is primarily used in the 3rd stage of S curve, where the focus is to reduce cost and maintain functionality (to reduce the denominator). An example could be in the improvisations of BS VI in India. Every automobile OEM released their improvised products by adhering to the BS VI norms starting 1st April 2020. Once the product was put in the market, every OEM has focused on reducing the cost either by elimination of parts or through substitution. With TRIZ methodology, we use the concept of Trimming for simplification both for products and process with novelty. Incremental innovation was used by automotive OEMs to steadily improve the product quality and reduce the cost using Kaizens. The benefit over kaizens is cost out with new IPR.
Sustaining innovation – By adding new features, new functionality is added through systems thinking approach. It is primarily used in 2nd stage of S curve. All these beneficial features increase the numerator of the Ideality. Sustaining innovation aims to improve existing products. It does not lead to creation of new markets, but rather develops existing market with better value. Sustaining innovation happens, in current market, in response to customer or market demand, or technology improvements. We see this in the smartphone market – every year, cell phone manufacturers release updated and improved products to meet consumer demand and to integrate new technology. In the automotive world, sustaining innovations include the introduction of speedometers, seatbelts, windshields and rear-view mirrors (1930 – 50) that was followed by the introduction of power steering, cruise control, three-point seatbelts etc (1950 – 60) [5].
Radical innovation – By adapting proven technologies from totally different disciplines to our product line and it is an outward approach. These adapted features increase the numerator of Ideality. It is primarily used in 2nd and 3rd stage of S-curve. A relevant example here is the drive-by-wire or X-by-wire technology used in cars. A car’s drive-by-wire relies mainly on electronics to control a wide range of vehicle operations, including acceleration, braking and steering. Conventional cars use hydraulic and mechanical technology to conduct these same basic operations, and although the systems are powerful, they can be overly complex, inefficient and subject to wear and tear over the years. Drive by wire technology replaces the traditional mechanical control systems with electronic control systems. It uses electromechanical actuators and human-machine interfaces such as pedal and steering feel emulators. Components such as the steering column, intermediate shafts, pumps, hoses, belts, coolers and vacuum servos and master cylinders are eliminated from the vehicle. This technology has been adapted from the fly-by-wire systems used widely in the aviation industry since the 1990s. By-wire systems began to be installed about twenty-five years ago, first in the military, and later in commercial aircraft. In the 1970s, NASA developed fly-by-wire technology to manoeuvre the Apollo Lunar Module [6].
From our S curve analysis, we observe that a variety of incremental, sustaining and radical innovations contribute to the continuous evolution of an MPV within a S curve. At the fourth stage, the S curve reaches a plateau and there is no further evolution of MPV. At this stage, disruptive innovations play an important role. Disruptive Innovations cause a discontinuity in the evolution of an MPV – they cause the technology to jump from the current S curve to the new S curve.
Disruptive innovation – By changing the functional principle of operation for the current MPV or by introducing a new MPV. A technological disruption is the result of the convergence of several technologies to enable a set of new competitors to emerge, and a different business model to establish itself as the new standard in the industry (based on new MPVs). Four new technologies: Connected, Autonomous, Shared and Electric (CASE) have converged to give rise to a new business model of Mobility as a Service (MAAS). These four trends, in turn, have been enabled by huge strides in battery and motor technology for electric vehicles (EVs); supercomputers, machine learning and AI for autonomous vehicles (AVs); smart phones, mobile internet and Apps for Shared Mobility (SM); and IoT, Data Analytics and cloud services for connected vehicles (CVs) [7].
The performance of today’s automotive products arises from its synchronization across four distinct layers in the stack
- The electric platform as the base layer of the stack can be visualized as a skateboard that replaces the old chassis. It’s modular, flexible, expandable and highly scalable. It carries the heaviest and most expensive component – the battery pack.
- The second layer of electronic platform enables data to be centralized, either in domain controllers or based on vehicle zones.
- The third layer of software platform, comprise of software models that are based on machine learning or artificial intelligence (AI) and deep learning.
- And the fourth and final layer of the stack is the cloud platform layer, it moves data from traditional on-premises servers to the cloud.
When we analyse the improved benefits or the reduced penalties that these disruptive innovations enable in automotive products, we either see a significant improvement in current MPV or the introduction of a totally new MPV. EVs are energy efficient – 20-30% energy conversion efficiency of ICE vehicles Vs. 70 – 80% for EVs. The cost of electricity as a fuel is cheaper and is more stable than the fossil fuel cost. The maintenance cost of EVs can be up to 10 times lower than ICE vehicles. EVs require fewer parts, offer much greater manufacturing flexibility and simplicity, and dramatically reduce the tailpipe emissions. Autonomous driving features can increase the utilization of vehicles to more than 80% instead of today’s low utilization of 10%. AVs have the potential to significantly reduce accidents caused by human error. AVs can reduce the traffic density, avoid traffic congestions and thereby improve productivity of people. AVs would leverage the connectivity between vehicles and between them and the road infrastructure. The MAAS model is highly data centric and offers an opportunity for industry players to mine the data, extract insights, create value for the customers and turn data into an important source of revenue. While energy efficiency, cost, passenger safety are the traditional MPVs, the access to rich data through smart and connected features has led to new MPVs.
Technology development being a non-linear evolution, a frequent question asked is, can we predict the direction of evolution? The direction of evolution can be predicted effectively by using the Trends of Engineering System Evolution, TESE depicted in Figure 4. The second part of our paper will analyse how an automotive OEM can predict effectively the next evolution of their products.
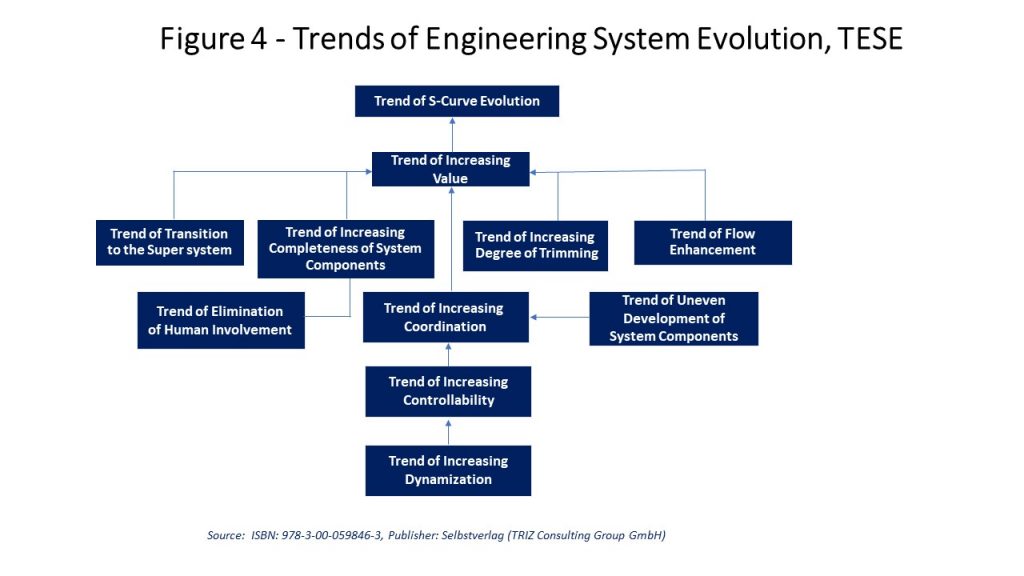
Figure 4: Trends in Engineering Systems Evolution (TESE)
Conclusion
For India to become a super power through Atma Nirbhar, it is important that the Indian mobility industry leads in technology, new product development (Invent in India®) and manufacturing (Make in India). Indian automotive OEMs can achieve this goal by focusing on the right MPVs and by tracing the evolution of MPVs along the S-curve. OEMs will craft the right product innovation strategies – incremental / sustaining / radical / disruptive through a rigorous S curve analysis. The authors firmly believe that the adoption of structured innovation methods of TRIZ (Structured Jugaad®) can (a) accelerate new product development, (b) strengthen new product differentiation by evolving the product features in new directions and (c) create strong intellectual property to protect the innovative features of the product. This article is the first in the series of articles aimed at exposing the power of structured innovation for automotive new product innovation.
Acknowledgement
The authors thank Dr Sergei Ikovenko for being their TRIZ teacher and mentor.
References:
- Anand Mahindra, M&M Group Chairman, 73rd Annual General Meeting, Mumbai, August 2019
- Ikovenko & A. Lyubomirskiy, Training Materials, GEN3 Partners, 2015
- Trends of Engineering System Evolution, Author:Alex Lyubomirskiy, Dr. Simon Litvin, Dr. Sergei Ikovenko, Prof. Dr.-Ing. Christian M. Thurnes, Dr. Robert
- https://www.epa.gov/transportation-air-pollution-and-climate-change/accomplishments-and-success-air-pollution-transportation
- Sustaining Innovation – https://voltagecontrol.com/blog/disruptive-innovation-vs-sustaining-innovation-a-time-place-for-both/#:~:text=Sustaining%20innovation%20happens%20on%20an,have%20demonstrated%20they%20value%20already
- Radical Innovation – Drive-by-wire technology – Drive by wire, Wikipedia; How drive-by-wire technology works, John Fuller, How Stuff Works ; What is drive-by-wire technology, Jeremy Laukkonen, July 16, 2021, Lifewire ; The coming revolution of drive-by-wire cars – https://www.youtube.com/watch?v=vlM-VcQVMo0; Driving by wire, National Museum of American History.
- Disruptive Innovation – https://hawksbillgroup.com/disruptive-innovation-in-the-automotive-industry/
 |
Tito Kishan Vemuri, CEO of Proinn Consultancy®, Founder Chairman of ATTI, India’s regional MATRIZ Association and Director of TRIZ deployment of MATRIZ in India. With 25+ years of corporate experience in technical innovation, operational excellence and organizational change, Kishan has facilitated 1000+ inventions. He has enabled millions of USD savings, over the last 15 years using the structured innovation methods of TRIZ, to various clients. Invent in India®, Structured Jugaad® and Proinn Consultancy® are registered trademarks of Tito Kishan Vemuri. |
 |
Dr Shankar venugopal is a Vice President at Mahindra & Mahindra. He leads technology innovation and knowledge management for the Automotive and Farm businesses. As the Dean of the Mahindra Technical Academy, he is focused on building future skills in automotive engineers. Shankar has developed a proprietary innovation technique “Innovation FLOW” and has coached 1000+ innovators. |